
Marketing Intelligence
Pricing Strategy · 2026년 6월 18일 · 11 분 읽기
For years, country-level pricing lived in a spreadsheet that translated a home-market price into other markets using VAT tables and a rough purchasing-power adjustment. In 2026 that spreadsheet is producing prices that are systematically wrong in ways that matter — too high in some markets, too low in others, and rarely aligned with what buyers in each market actually treat as the credible price band. Here is why country-specific pricing decisions have outgrown the spreadsheet, what the decision surface actually needs to include, and how enterprises are shifting from single-price-with-adjustments to genuine per-market price setting.
For a long time, country-level pricing was treated as a translation problem. You set the price in your home market. You applied the local VAT rate. You made a rough adjustment for purchasing power or currency. You wrote the result into a spreadsheet and sent it to the local team. The spreadsheet had a column per country and a formula per row. It was fast to build, easy to update, and it worked well enough — for a market where buyers were mostly comparing against the same reference points and where the price band that felt credible in one country was a reasonable proxy for the price band that felt credible in another.
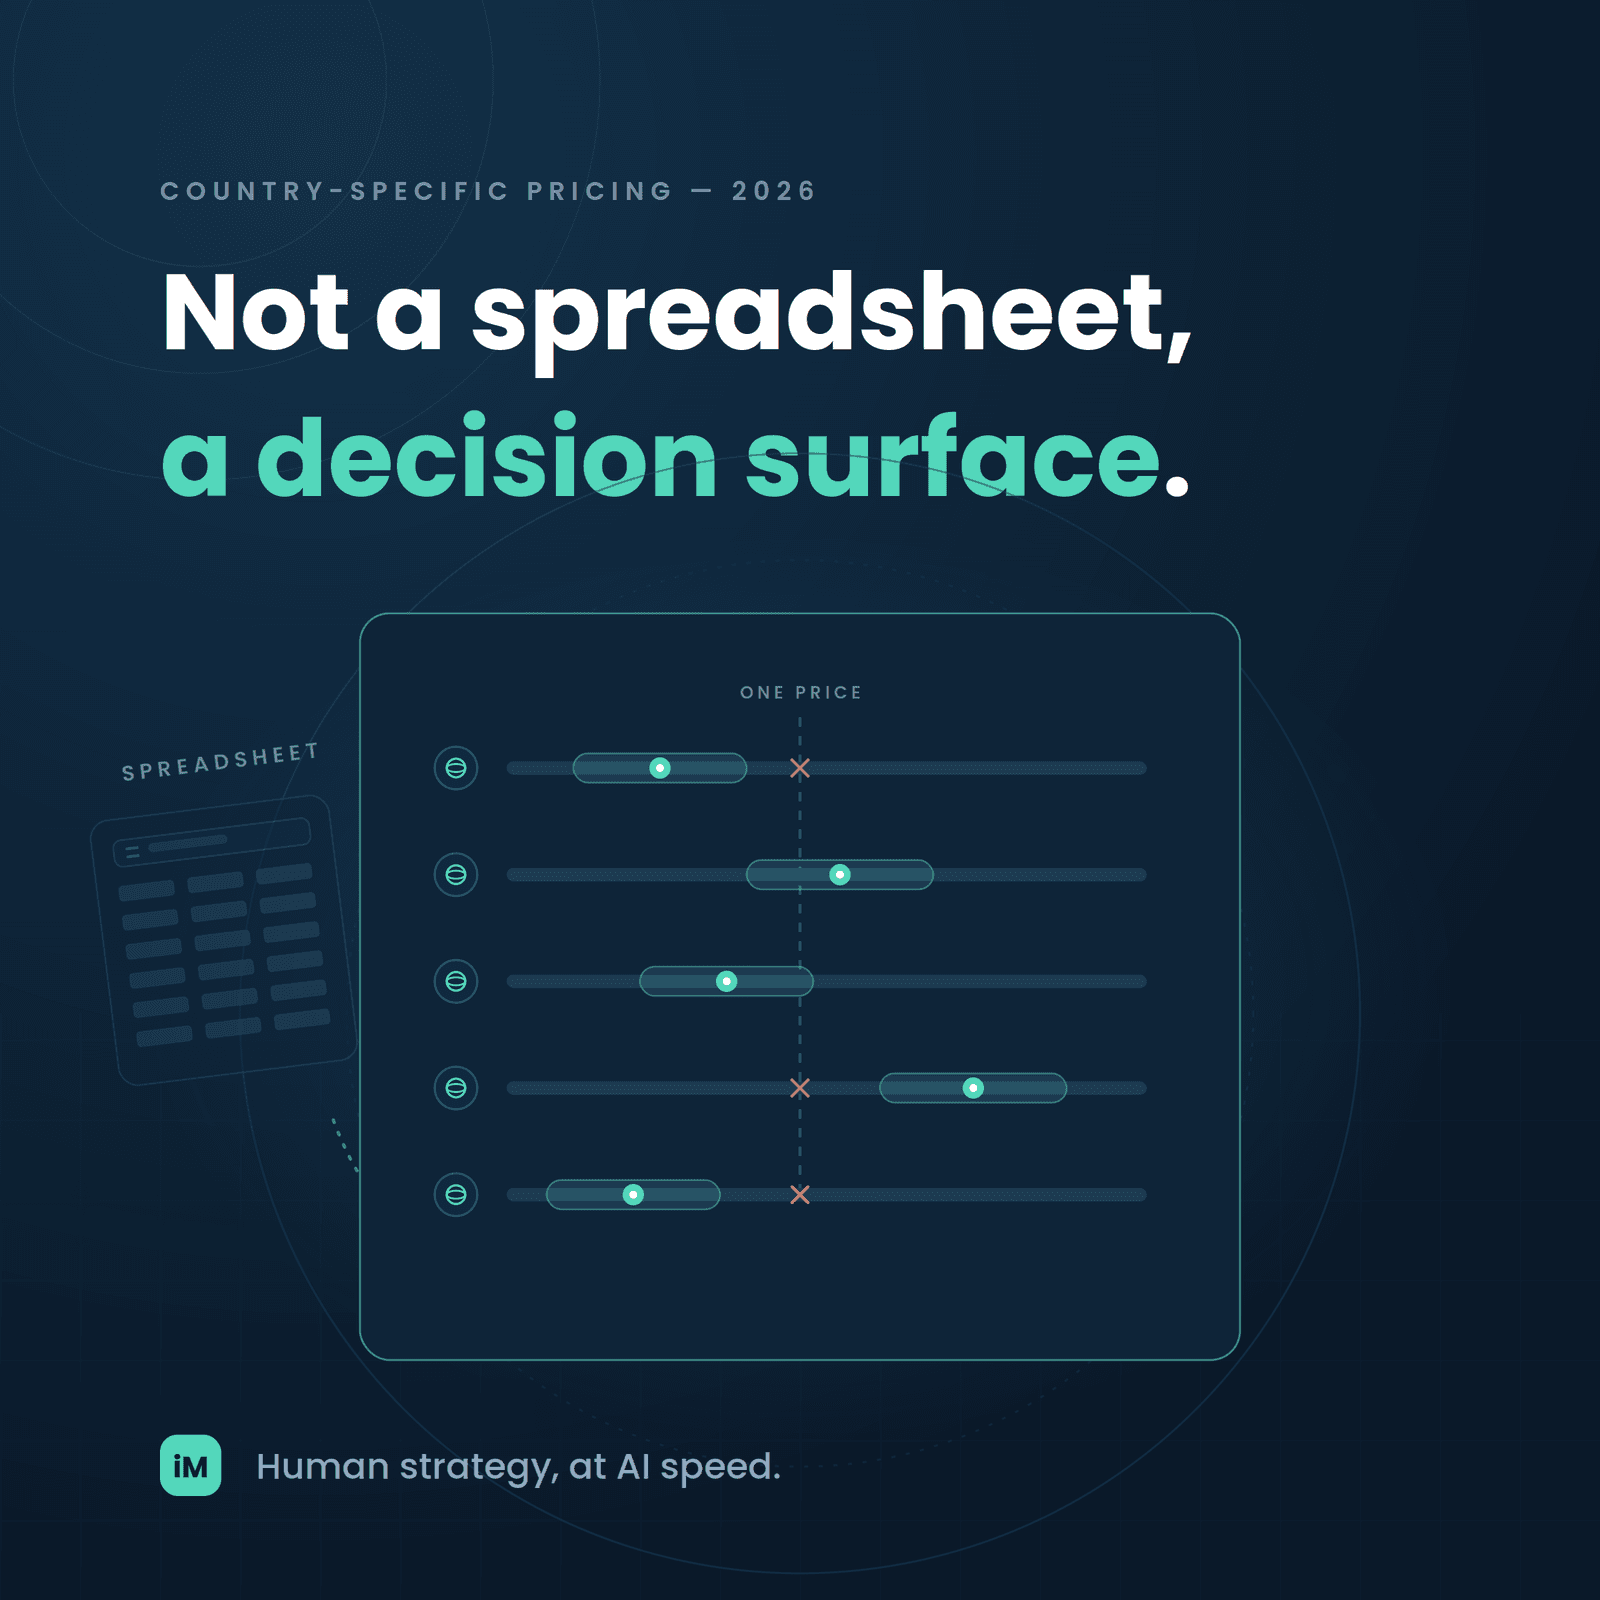
In 2026 that spreadsheet is producing prices that are systematically wrong in ways that matter. It is too high in markets where the credible price band has quietly narrowed. It is too low in markets where premium positioning has become the price the buyer expects. It is missing the country-specific competitor set that has emerged in every meaningful category. And it is producing a single number that ignores the three-scenario range — aggressive, balanced, premium — that most enterprises need in order to make a real pricing decision rather than a defaulted one.
This piece walks through why the spreadsheet is no longer enough, what the country-specific pricing decision surface actually needs to include, and how enterprises are shifting from single-price-with-adjustments to genuine per-market price setting. The goal is not to abandon the spreadsheet — the spreadsheet still has a place — but to build the decision layer above it that makes the pricing right rather than translated.
The spreadsheet approach to country pricing rested on four assumptions. Each one made sense when it was formed. Each one has quietly weakened over the past decade and is now producing pricing errors that show up in either lost margin or lost sales.
The spreadsheet's core assumption is that the price band a buyer will accept — the range between what feels suspiciously cheap and what feels prohibitively expensive — is broadly similar across markets, so a home-market price plus a purchasing-power adjustment lands in the credible band in every market. That was roughly true in the 2010s when premium and mainstream positioning translated fairly cleanly between developed markets. It is materially less true in 2026.
The credible price band is now shaped by country-specific competitive sets, country-specific perception of premium versus mainstream, and country-specific inflation and cost-of-living context. A price that lands in the middle of the credible band in one market can land at the top of the band in another and outside the band entirely in a third. The purchasing-power adjustment captures affordability but does not capture perception, and perception is where most of the pricing decision actually happens.
The spreadsheet implicitly treats the competitive set as global. Your product competes against the same set of products in every market, so the reference price is roughly the same. That was closer to true when international brands dominated most categories globally. In 2026 nearly every category has strong country-specific competitors — regional challenger brands, private-label alternatives, digitally-native local disruptors — that shift the reference price the buyer actually uses when evaluating your price.
The pricing decision has to be made against the competitive set the buyer actually sees, not against the competitive set the head office is used to seeing. That is a per-market calculation, not a single translated number. Enterprises that miss this end up priced against a competitive set that does not match the buyer's evaluation, and the mismatch shows up in conversion rates rather than in the pricing model itself.
The spreadsheet approach assumes that if your product is perceived as premium in your home market, it will be perceived as premium in every other market, and the price should reflect that. That assumption breaks in both directions. A brand that is premium in its home market can be mid-market in a country where the international category leader occupies the premium tier. A brand that is mid-market at home can be premium abroad if the country has fewer international entrants and treats your brand as the aspirational option.
The pricing decision has to reflect where the brand sits in the country's own quality perception hierarchy, not where it sits at home. That requires country-specific perception data — how the brand is described by buyers, by the local competitive set, and by the local media and AI engines — which the spreadsheet does not incorporate.
The spreadsheet outputs one number per country. That output implies that pricing is a set-and-forget decision — pick a number, apply it, review annually. In 2026 pricing is a strategic range decision that needs to be understood at three scenarios: aggressive (share-focused, lower margin), balanced (default, target margin), and premium (margin-focused, higher-perceived-value). Each country needs the range, not the single point, and the choice of which scenario to run in each country needs a rationale tied to the market's actual state.
The single-number output prevents the enterprise from having the strategic conversation about scenario choice per country. It just delivers a price. That was acceptable when markets were similar enough that a default scenario worked everywhere. It is no longer acceptable when country markets diverge and the choice of aggressive-versus-premium in each market is a real strategic lever.
A country-pricing decision that is fit for 2026 needs to combine six inputs into a per-market recommendation. Each of the six answers a different question about the specific market, and skipping any of the six is what produces the spreadsheet's systematic errors.
Together these six inputs produce a per-country price recommendation that reflects the market's real conditions rather than a translated home-market number. The decision surface is the layer above the spreadsheet — it does not replace the tax and currency calculation, but it wraps that calculation in the market context that decides whether the calculated price is the right one.
When the spreadsheet approach produces the wrong price, the failure tends to fall into one of two modes. Naming them lets the enterprise recognize which mode it is operating in and correct without needing to overhaul the entire pricing process at once.
The most common failure mode is a price that is too high for the local credible band. This happens when the home-market price is translated with a purchasing-power adjustment that undercounts either the affordability gap or the strength of the local competitive set. The buyer's mental reference price is anchored lower than the translated price, and the product looks expensive without the perceived value that would justify the premium.
The visible symptom is a below-target conversion rate that the local team explains as "the market is not ready" or "the buyer is price-sensitive." The real symptom is that the price is above the credible band the buyer uses, and no amount of marketing spend will move the conversion rate materially until the price moves into the band. Enterprises that recognize this failure mode adjust the local price down, sometimes with a specific scenario shift from balanced to aggressive, and see conversion rates recover within a quarter.
The reverse failure mode is a price that is below the local credible band. This happens when the home-market price is translated without adjusting for premium positioning that the brand already commands in the local market — often because the local team has more information about the brand's local reputation than the head office has integrated. The buyer's mental reference price is anchored higher than the translated price, and the low price signals lower quality than the brand actually delivers.
The visible symptom is that the product is selling but earning less margin than the market would bear, and often that a competitor with a very similar product is earning materially more margin at a higher price. The real symptom is that the price is below the band the buyer would accept, and the enterprise is leaving margin on the table because the price was set to translate from the home market rather than to reflect the local premium. Recognizing this failure mode is often harder because the volume looks acceptable, but the margin gap is real and it compounds over time.
Enterprises that move from spreadsheet pricing to per-market decision-based pricing do it in a specific sequence. The sequence matters because the intermediate steps produce operational learning that shapes the final state, and skipping the intermediate steps tends to produce a new system that is more sophisticated but not necessarily better calibrated to the markets.
The transition typically takes two to three quarters for a mid-sized enterprise operating in five to eight countries. It is a real change of process, not a change of tool, and the pricing team gains operational muscle each cycle. The end state is not a fancier spreadsheet. It is a decision surface that the pricing team can run confidently in every market they operate in.
Enterprises that shift to per-market decision-based pricing tend to hit specific patterns in the first year that indicate the shift is producing real value.
The spreadsheet was the right tool for a market where translating a price was enough. The decision surface is the right tool for a market where the price has to be right for each country, not just derived from the home market. The tool changed because the market changed.
inMOLA's Pricing Strategy module is built as the decision surface above the calculation. The tax, currency, and cost calculation still runs deterministically — the numbers are computed, not guessed. What the module adds is the market-context layer that most pricing spreadsheets do not include. Country-specific competitive sets are pulled from the same continuously refreshed data streams that feed the Competitive Intelligence module. The country's credible price band is bounded by the observed competitor prices in that market. The country's quality perception is drawn from the same benchmark and sentiment data that flow through the wider inMOLA decision engine.
For each product-country pair, the module produces the three-scenario range — aggressive, balanced, premium — with the reasoning surfaced next to the numbers so the pricing team can decide which scenario to run rather than accepting a default. The output is a per-market recommendation with a documented rationale, not a translated home-market number. Because the underlying market data refreshes continuously, the recommendation stays current as the market shifts, and the quarterly pricing review is supplied by refreshed inputs rather than a snapshot from three months ago.
The strategic value of the shift is not that the pricing calculation is fancier. The calculation is still the same fundamentally deterministic operation. The value is that the calculation is being done with the right inputs for each market, and the output reflects the market's actual conditions rather than a translated approximation of them. In 2026 that difference is the difference between pricing that captures the margin the market will bear and pricing that either leaves margin on the table or prices the product out of the credible band.
Marketing Intelligence

Decision Intelligence

Marketing Intelligence