
Marketing Intelligence
Portfolio Strategy · 6 июня 2026 г. · 12 мин чтения
A composite case drawn from three multi-brand groups shows how a modernized BCG matrix — with AI visibility and digital demand data on both axes — moved a CFO from an annual reallocation cadence to a six-week reprioritization that shifted marketing spend across four brands, killed one, and rescued another that the annual review would have divested. Here is the walkthrough, quadrant by quadrant, decision by decision.
This piece is a composite case, drawn together from three multi-brand consumer and B2B groups that reworked their portfolio review process during 2025 and 2026. The names and numbers are illustrative rather than any single company's, but the reallocation pattern — and the specific decisions that fell out of the modernized matrix — reflect real portfolio moves that these groups made. The value in walking through it is not the numbers, which will differ in every portfolio. It is the sequence of decisions that a rebuilt BCG matrix pushes a CFO toward, and the way those decisions differ from what the annual planning cycle would have produced.
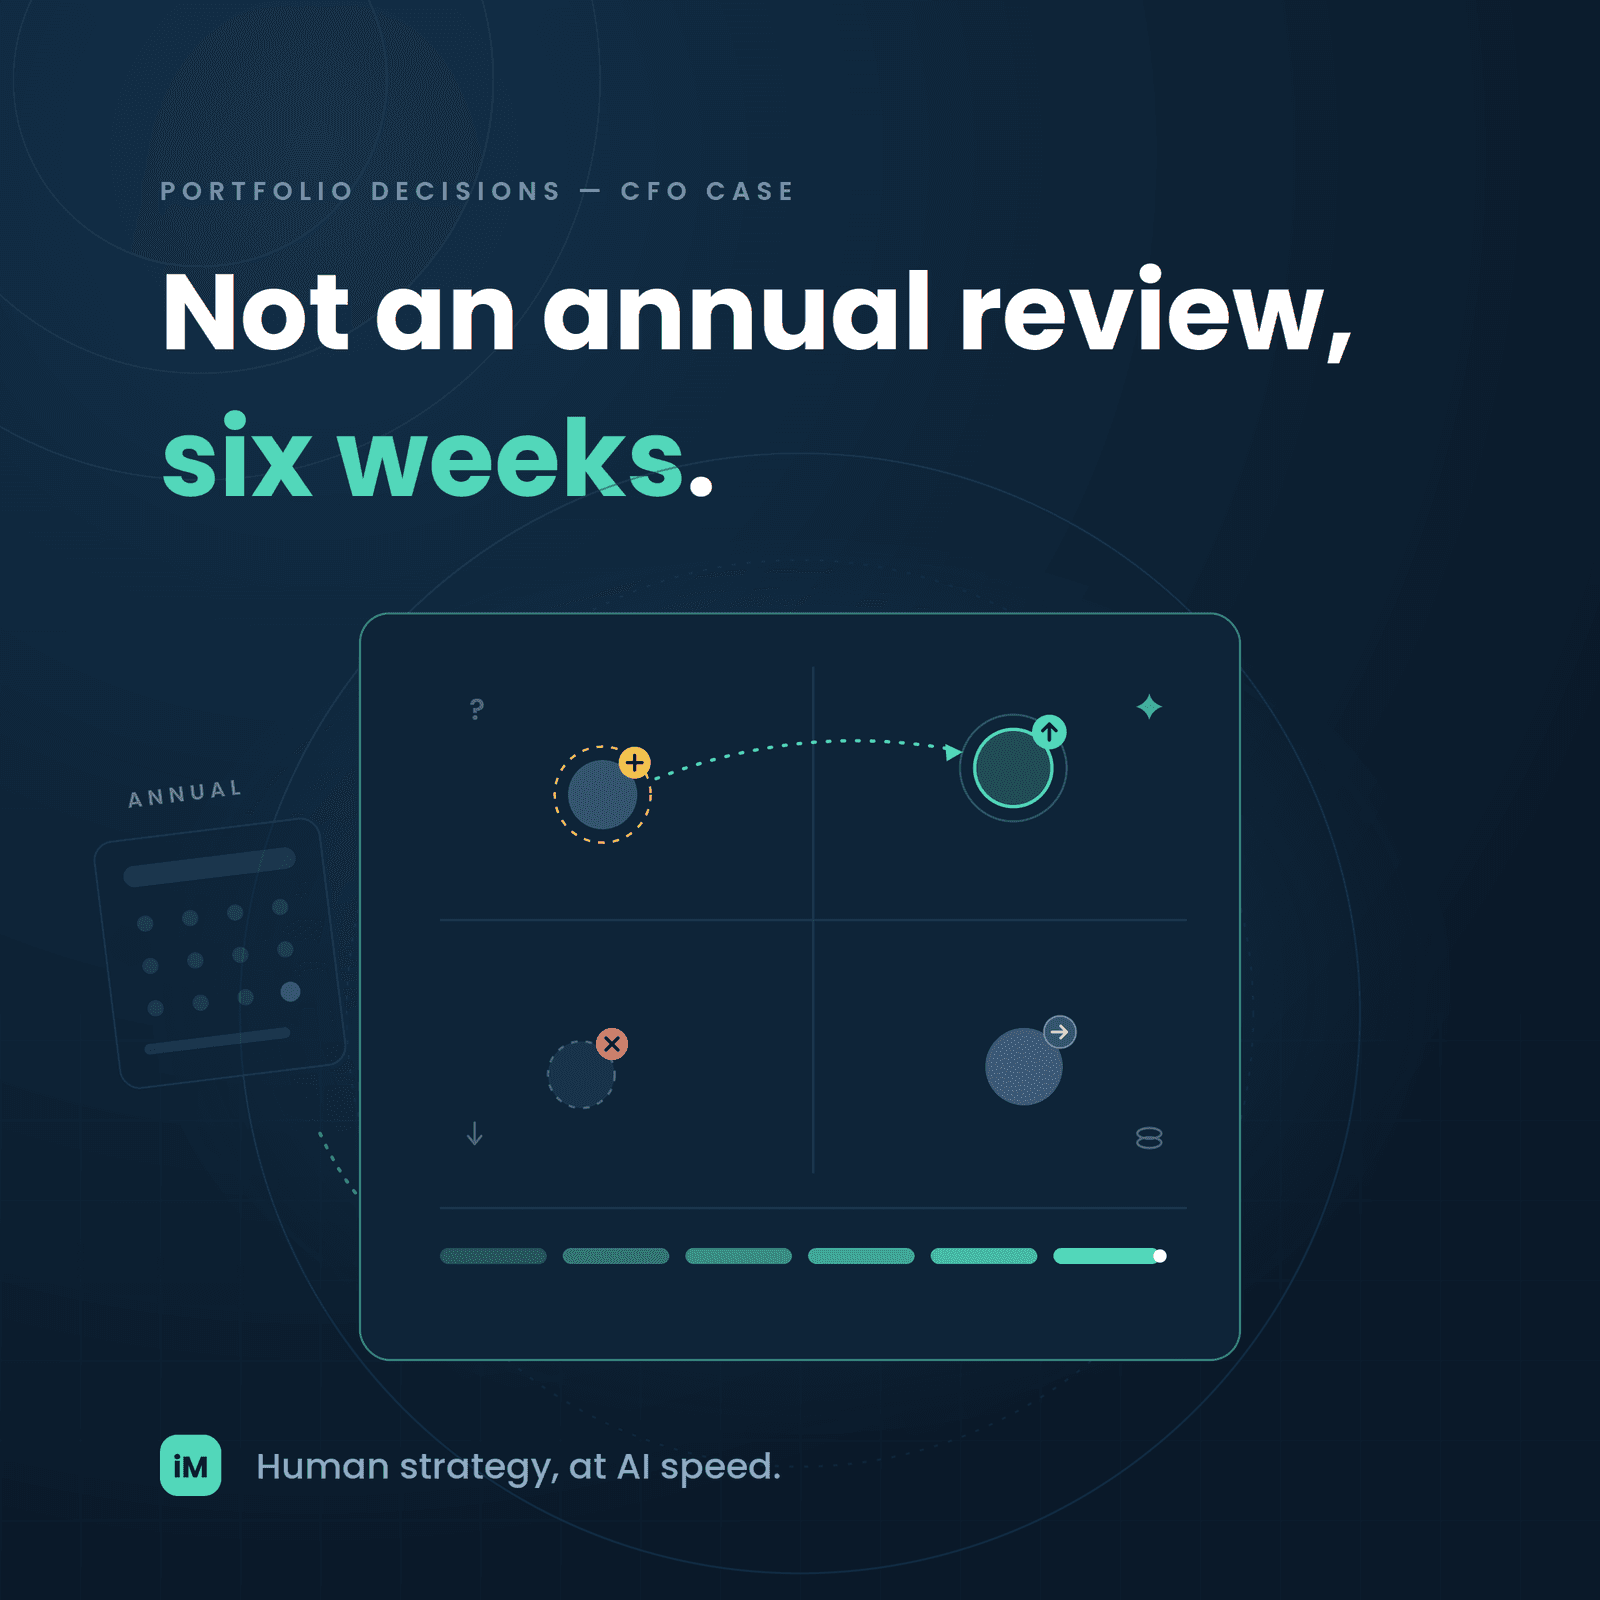
The composite CFO — call her Sarah — runs finance for a group with nine brands across two adjacent consumer categories. Historically the group ran a full portfolio review in the first quarter of the calendar year, driven by trailing revenue data, and the resulting marketing-spend allocation held for twelve months. In 2025 the CFO and CMO agreed to move to a quarterly matrix review using a modernized set of inputs. This walkthrough is the first of those quarterly reviews, and it produced four decisions that would not have come out of the annual cycle.
Nine brands, four in one category (call it Category A, a maturing premium segment) and five in an adjacent category (Category B, a faster-growing wellness-adjacent segment). Trailing revenue growth on the group was 6% year-over-year. The historical marketing spend allocation split roughly proportionally to trailing revenue, with a modest topspin toward the two largest brands. The group's story to the board had been that the portfolio was performing steadily and that reallocation would happen at the annual review if the trailing numbers materially shifted.
That story hid the shifts that were actually happening underneath. Two brands were losing AI category-mention share fast even though their revenue had not yet cracked. One brand that finance considered a candidate for wind-down was quietly compounding on demand-side signals. One brand that the marketing team believed was a rising star was actually being overtaken in AI recommendations by a smaller competitor that the group did not track closely. None of this showed up in the trailing revenue data. All of it showed up when the matrix was rebuilt with leading indicators on both axes.
Each brand was scored on the vertical axis as a composite of category revenue growth (lagging), category-level search and social demand momentum (leading), AI category-recommendation share for the brand's category (leading), and observed competitor investment velocity in the category (leading). Each brand was scored on the horizontal axis as a composite of relative revenue share versus the top three competitors in the category (lagging), AI mention share in category-defining queries (leading), and a composite benchmark score covering brand strength, digital performance, and sentiment (leading).
The medians of both axes across the nine brands defined the quadrant boundaries. The result was a portfolio-relative picture. Three brands sat in the Star quadrant, two in the Cash Cow quadrant, three in the Question Mark quadrant, and one in the Dog quadrant. That distribution alone was not the surprise — most nine-brand portfolios produce a distribution roughly like it. The surprise was which brands sat where.
Two of the Stars were expected. Brand C1 and Brand C2, both leading brands in Category B, had strong revenue growth, dominant AI recommendation share, and strong benchmark composites. The finance team already knew they deserved incremental investment. The matrix confirmed the intuition, but it also quantified the size of the AI lead — both brands were mentioned in more than 70% of tracked category queries in ChatGPT and Perplexity, well above the median of the portfolio. That quantification made the reinvestment case easier to defend to the board because the AI lead was not a marketing claim; it was a measured signal.
The unexpected Star was Brand C5, a smaller brand in Category B that the finance team had been treating as a middle-of-the-pack performer. Its trailing revenue growth was modest, but its AI recommendation share had increased sharply over the trailing 90 days, its digital demand signals were accelerating, and its benchmark composite had risen above the median. The composite score pushed it into the Star quadrant. The CFO's response was to reallocate a portion of marketing spend from a Cash Cow to Brand C5 — a decision she would not have made against the annual trailing revenue data because the revenue evidence had not yet caught up with the momentum evidence.
The Star quadrant is the easiest to communicate but the hardest to execute well. "Invest at scale" is trivially easy to say and dangerously easy to overspend on. The matrix review disciplined the Star investment by decomposing it. Brand C1 and Brand C2 each received an investment plan that tied incremental spend to specific leading indicators — a target AI mention share, a target category demand share, a target benchmark composite — with quarterly review gates. Brand C5 received a more contained investment sized to prove the AI lead was durable before doubling down further. All three plans had an explicit reallocation source: the Cash Cow reallocations described in the next section.
Two brands sat in the Cash Cow quadrant. Brand C3 and Brand C4, both in Category A, had high relative share and mature category dynamics. Trailing revenue growth was low, benchmark composites were strong, AI recommendation share was moderate. The classical read is straightforward — optimize for margin and cash generation, hold marketing spend at a maintenance level.
The matrix review pushed further. Brand C3's AI mention share in Category A had been slowly declining over the trailing two quarters, while a smaller Category A competitor's share had been rising. The declining AI mention share was not yet showing up in revenue — Category A revenue is sticky and lagged — but it was a leading indicator of shortlist erosion. The response was not to milk Brand C3 for more cash. It was to redirect a portion of Brand C3's brand marketing budget toward a targeted AI visibility recovery — a defensive investment justified by the leading indicator, not the trailing revenue.
Brand C4 was the reverse case. Its AI mention share was stable, its benchmark composite was among the highest in the portfolio, and its digital demand signals were flat but not declining. The response was to accept the cash cow reading and reallocate a portion of its marketing spend to the newly-identified Star, Brand C5. This is the classic BCG allocation — cash cow funds star — but the identification of both the cash cow's stability and the star's momentum came from the leading indicators, not from the trailing revenue.
The modernized matrix produced three different Cash Cow strategies for three effectively similar-looking trailing revenue profiles. Brand C4's cash was reallocated to fund Star investment. Brand C3's cash was retained but redirected within the brand toward AI visibility defense. The uniform "milk the cow" reading of the classical framework misses these distinctions. The composite scoring with leading indicators surfaces them.
Three brands sat in the Question Mark quadrant — high category growth momentum, below-median relative competitive position. The classical read is that each requires an explicit invest-or-exit decision. The matrix review made those decisions specific rather than generic, because each of the three brands sat in the quadrant for a different reason.
Brand C6's revenue share was low, but its AI mention share had risen sharply over the trailing quarter as it published a series of well-received original research pieces that AI engines began citing. The category was growing quickly. The composite pushed the brand into the Question Mark quadrant, but the leading indicators pointed toward it becoming a Star over the next two to three quarters. The CFO's decision was to invest, with the investment tied to specific AI visibility milestones that would trigger further capital release.
Brand C7 had comparable trailing revenue to Brand C6 but flat AI recommendation share and flat benchmark composite. The category was growing, but Brand C7 was not participating in the category's growth in any leading indicator. The decision was to hold current spend, avoid incremental investment, and re-run the matrix in a quarter. If the leading indicators had not moved, Brand C7 would be reclassified as a Dog in the next review. The explicit "one quarter to prove momentum" framing was more decisive than the annual review would have produced, without being permanently divestive.
Brand C8 was a small brand acquired three years earlier that had never developed traction. Trailing revenue was flat, AI mention share was near zero, benchmark composite was in the bottom quintile. The classical Question Mark read might have suggested one more investment cycle. The composite score, when compared against the portfolio median and the specific opportunity cost of the incremental spend, made the case for exit clear. The brand was wound down over the following two quarters. The freed marketing budget was reallocated to Brand C6 and Brand C5.
One brand — Brand C9 — sat in the Dog quadrant. Category A growth was low. Brand C9's relative revenue share was low. The classical read is divestiture. The matrix review produced a different response.
Brand C9's AI mention share had been quietly rising over the trailing three quarters as the brand's product line had shifted toward a niche that AI engines were increasingly recommending. Digital demand signals for the sub-category the brand was moving into were accelerating faster than Category A as a whole. The composite score placed the brand in the Dog quadrant because it averaged the mature Category A dynamics against the emerging sub-category dynamics. Decomposing the score revealed a rescue opportunity that the annual review would have missed.
The CFO's decision was to hold the divestiture recommendation and give Brand C9 two quarters to demonstrate whether the sub-category shift produced revenue traction. The marketing spend was held constant, but the go-to-market focus was narrowed sharply to the sub-category where the leading indicators were strongest. Two quarters later — outside the scope of this walkthrough — the brand had shifted from Dog to Question Mark on the next matrix, and the divestiture was formally shelved.
The Dog quadrant is often over-triggered by lagging inputs. A brand can look like a Dog on trailing revenue and relative share while its leading indicators are quietly recovering. The disciplined response is to decompose the composite score and check whether the leading indicators justify a rescue window. If they do, hold and give a specific window. If they do not, divest. Either way, the decision is faster and more explicit than the annual review would produce.
The value of the modernized matrix is not that it changes the four quadrant labels. It is that the plotted positions reflect what is actually happening in the market months before revenue confirms it — and that the reading pushes a CFO toward decisions the trailing data would not have supported yet.
The reallocation this walkthrough describes did not happen in a single meeting. It took roughly six weeks from the first matrix review to the last portfolio decision being executed.
The point is not that six weeks is fast in absolute terms. It is that six weeks is a quarterly cadence, and moving from an annual reallocation cycle to a quarterly one changes the portfolio's ability to respond to leading indicators before they become lagging ones. The CFO in this composite case moved from being a year behind the market to being a quarter behind it. In a market where AI-driven discovery is reshaping categories on quarterly timescales, being a quarter behind rather than a year behind is decisive.
The composite case describes a matrix review that requires inputs from four different data domains — finance, marketing analytics, AI visibility monitoring, and competitor benchmarking. Most enterprises pull these inputs together manually for the annual review and stop there because the manual reconciliation is too expensive to repeat quarterly.
inMOLA's BCG Box Matrix module runs on the continuously refreshed AI visibility and competitor benchmark signals that flow through the rest of the inMOLA decision engine, and combines them with the finance and marketing inputs the enterprise supplies. The composite scores update as the leading indicators update, the quadrant plot refreshes with the new positions, and the CFO can move from an annual matrix to a quarterly one without adding manual reconciliation work each cycle.
The specific decisions the modernized matrix pushes a CFO toward — Star elevation on AI momentum, Cash Cow defensive investment on AI erosion, disciplined Question Mark resolution, decomposed Dog rescue — are the decisions that separate portfolios that reallocate on the leading edge from portfolios that reallocate on the trailing edge. In 2026, the leading-edge portfolios are the ones that compound advantage.
Marketing Intelligence

Decision Intelligence

Marketing Intelligence