
Marketing Intelligence
Social Media KPI · June 24, 2026 · 11 min read
Every social team has faced the same question — which of the six major platforms is genuinely producing value for the brand, and where should incremental effort go? The intuitive answer, which is to compare each platform's headline numbers side by side, produces conclusions that are systematically wrong. Here is why cross-platform comparison is harder than it looks, what a defensible comparison actually requires, and how to reach an honest verdict on which platforms deserve continued investment.
Every social team eventually faces the same question. Which of the six major platforms — Instagram, Facebook, YouTube, LinkedIn, X, TikTok — is genuinely producing value for the brand, and where should incremental effort go? The intuitive answer is to line up the headline numbers side by side and compare. Platform A produced fifty thousand followers this quarter. Platform B produced twenty thousand. Platform A wins. Reallocate.
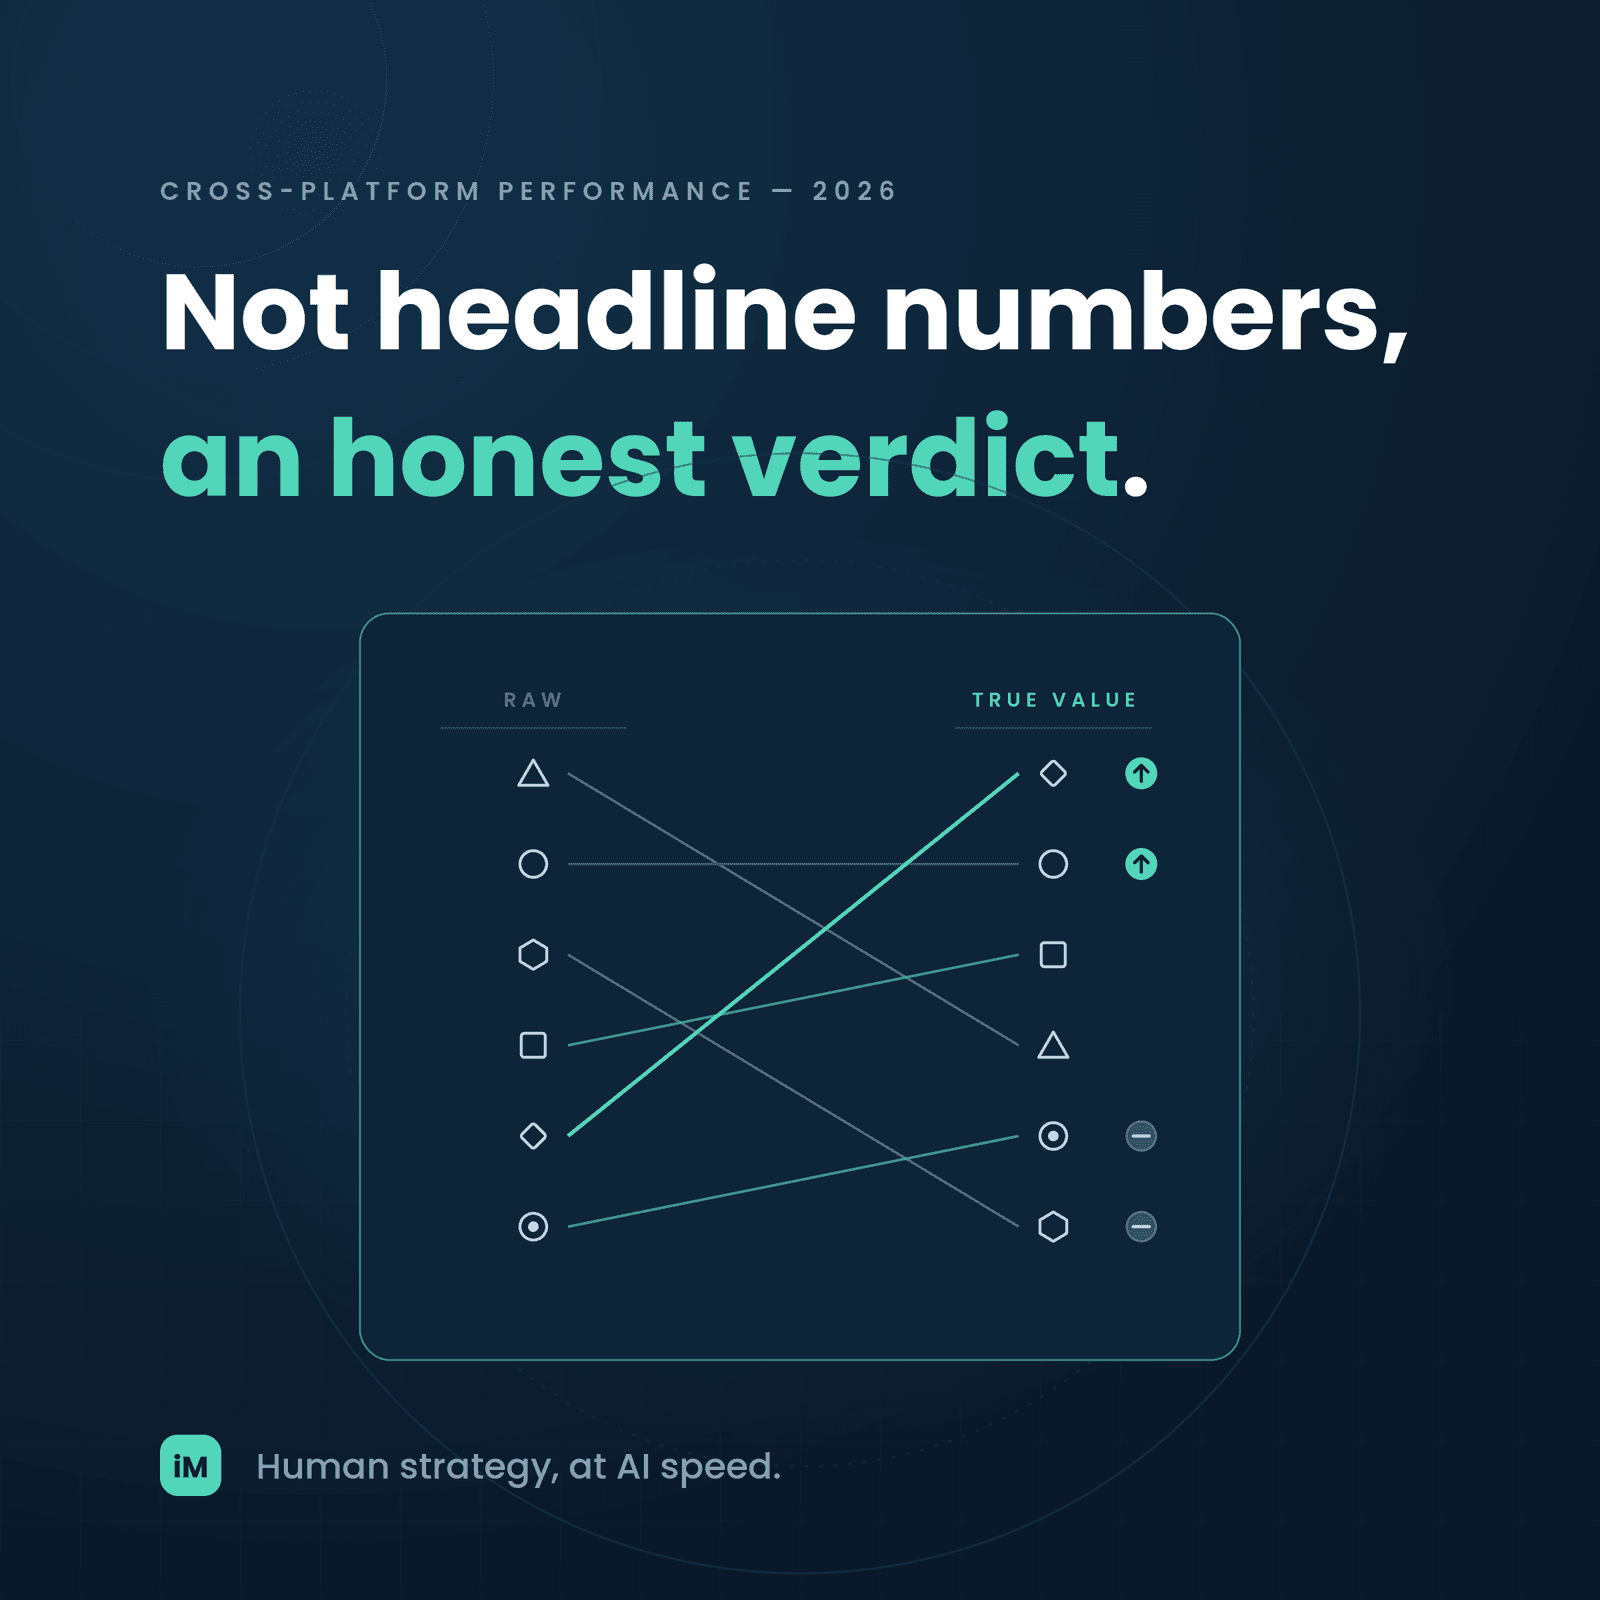
That comparison feels rigorous. It is not. It systematically produces conclusions that mislead the reallocation decisions the team is trying to make, because it treats numbers that come from different platforms with different definitions as if they were directly comparable. The team that reallocates on those conclusions ends up doubling down on platforms that looked strong because of measurement artifacts and starving platforms that looked weak for reasons that had little to do with genuine performance.
This piece walks through why cross-platform comparison is harder than it looks, what a defensible comparison actually requires, and how to reach an honest verdict on which platforms deserve continued investment. The goal is not a perfect ranking. It is a comparison that a social team can defend as reflecting genuine platform performance, and a decision framework that produces reallocation choices that hold up in retrospect.
The core problem is that the six major platforms define their headline numbers differently. An impression on one platform is not the same as an impression on another. A view on one platform is not the same as a view on another. A follower on one platform does not represent the same relationship depth as a follower on another. When these differently-defined numbers are placed side by side in a comparison table, the table looks legitimate but the comparison it invites is false.
An impression on one platform might require the post to have been in the visible screen area for a minimum time. An impression on another might count any presence in the feed, however brief. An impression on video-first platforms is often counted differently from an impression on image-first platforms even within a single account's data. Comparing impression totals across platforms is comparing definitions as much as it is comparing performance.
A view on one video platform might require several seconds of watch time. A view on another might count almost any exposure. A view on a scrolling short-form video platform can count differently from a view on the same platform's long-form video product. Two platforms can each report "one million views" for a piece of content and mean quite different things by it.
A follower on a professional network platform is engaging with the brand in a different context — and typically with different intent — than a follower on an entertainment-first platform. A hundred thousand followers on the professional platform may represent a smaller audience than a hundred thousand on the entertainment platform, but each interaction may carry more weight for certain kinds of business outcomes. Follower counts across platforms cannot be summed or averaged without losing this distinction.
An engagement rate of 3% might be exceptional on one platform and mediocre on another. Different platforms have structurally different engagement patterns — the feed algorithm, the content format, and the user behavior all shape what a normal engagement rate looks like. Comparing raw engagement rates across platforms without adjusting for these baselines produces false conclusions about which content is genuinely resonating.
A cross-platform comparison that supports investment decisions has to bridge the definition gaps between platforms. That means measuring each platform against its own definitions and baselines, then translating the per-platform assessments into a common framework the team can use to compare across the portfolio. Four inputs bridge the gap.
Rather than comparing raw impression or view totals, the comparison uses reach relative to the follower base as a common frame. A post that reaches 15% of a platform's follower base is being compared to a post that reaches 15% of another platform's follower base, and the ratio is meaningful even though the absolute numbers differ. This treats each platform on its own scale and lets the team see which platforms are actually earning attention from their audiences.
Engagement rate is meaningful when it is compared to what normal looks like on the same platform, not to a global average. An engagement rate that is 40% above the platform's own baseline for the brand's category is a strong signal, whether the absolute number is 1.5% or 5%. This makes engagement performance comparable across platforms without pretending the raw rates are on a common scale.
Follower growth momentum captures whether the platform is expanding the brand's audience or holding it steady. A platform that is growing followers 8% quarter-over-quarter is expanding the brand's presence on that platform, regardless of the absolute follower count. A platform that has flat or declining growth is stalling. The momentum is more informative than the total for the reallocation decision, because the reallocation is about where to invest incremental effort.
For platforms where video is central, the comparison should use genuine view counts and completion signals rather than raw view totals. A platform where the brand's videos are being watched to completion is producing a different level of value than a platform where the videos are being served but not held. This distinction matters especially for the video-first platforms in the portfolio, and it is where the too-many-brands-optimize-for-vanity-metrics problem tends to concentrate.
With the four inputs in place, the team can produce a per-platform assessment that captures how the platform is genuinely performing for the brand. The assessment has three tiers.
A platform where reach relative to follower base is healthy, engagement rate is above the platform's baseline, follower growth momentum is positive, and (for video-heavy platforms) genuine viewership is being earned. This is a platform that deserves continued and probably incremental investment. The team can defend the assessment with numbers that mean what they say.
A platform where the fundamentals are stable but not exceptional. Reach and engagement are at or near the platform baseline. Follower growth is slow but positive. Viewership is being earned but not accelerating. This is a platform that deserves continued investment at the current level, but incremental effort is likely to earn more elsewhere. The team is holding position rather than expanding it.
A platform where the fundamentals are weak. Reach relative to follower base is low. Engagement is below the platform baseline. Follower growth is flat or negative. Viewership is not being earned. This is a platform that needs either a strategic reset — different content approach, different frequency, different audience targeting — or a deliberate decision to deprioritize. Continuing to invest at the current level without change tends to produce continued underperformance.
When the six platforms have been assessed against these four inputs and tiered accordingly, the reallocation conversation becomes structured rather than intuitive. The team is not debating which platform's headline number looks bigger. The team is looking at a per-platform assessment that captures how each platform is genuinely performing on its own scale, and can make deliberate investment choices.
Cross-platform comparison has some specific failure modes that most enterprises fall into at least once. Naming them helps the team recognize the pattern before it drives a bad reallocation decision.
Reporting a single "total social reach" across platforms is one of the most common failures. The number sums differently-defined impressions from different platforms into a total that cannot be interpreted. Executives look at the total, notice it grew, and conclude social is working. In reality the number may be growing because inflation on one platform is outpacing decline on another. Reporting per-platform performance separately, without a false total, is more honest and produces better decisions.
A brand that treats the six platforms as if they were interchangeable audiences will typically underperform on all of them. Each platform has its own content culture, its own preferred format, its own engagement patterns. The comparison should factor in whether the brand is using content that is appropriate to each platform — a platform can look like a Struggling platform simply because the brand is posting the wrong kind of content there. That is a content problem, not a platform problem.
New platforms consistently attract disproportionate investment attention because their growth rates look impressive. A platform doubling its user base looks like a place to invest. The comparison should focus on whether the platform is genuinely producing value for the brand, not on the platform's own growth story. A rapidly growing platform where the brand's engagement is weak is still a Struggling platform for the brand, and the platform's growth trajectory does not fix the brand's problem on it.
The four-input comparison should be run on a defined cadence — usually quarterly — not every time a single post underperforms or overperforms. Frequent reallocation based on short-term signal produces whiplash decisions that never let a platform strategy play out. The team should let the assessment run for a full period before making reallocation moves, and should look at the trend across periods rather than at the single most recent one.
Cross-platform comparison is not about which platform produces the biggest number. It is about which platform is genuinely earning attention from its audience on its own scale. The comparison that respects that distinction produces reallocation decisions the team can defend. The comparison that ignores it produces reallocation decisions the team quietly regrets.
inMOLA's Social Media KPI module tracks the six major platforms with the four inputs the honest comparison requires. Reach relative to follower base is computed per platform on the same underlying discipline. Engagement rate is measured against each platform's own baseline rather than against a false global average. Follower growth momentum is captured continuously so the reallocation conversation is supplied by trend, not by a single-quarter snapshot. Genuine viewership is used for video content, avoiding the inflated-view problem that misleads video-heavy platform comparisons.
The output is a per-platform assessment that supports a defensible reallocation conversation. Each platform sits on its own scale, tiered as Strong, Steady, or Struggling based on the four inputs together rather than on any single headline number. The team can look at the assessment, discuss which platforms deserve incremental investment and which should hold or reset, and produce a documented reallocation plan that the next quarter's assessment can measure against.
The strategic value of the shift is not that the comparison is more sophisticated. The value is that the comparison is more honest, and the decisions it drives are the ones that hold up when the results come in a quarter later. In 2026 the social programs that reallocate on honest cross-platform comparison compound their returns against the programs still chasing the biggest headline number — and the compounding is more consequential than most social leads realize until they have been through several cycles of it.
Marketing Intelligence

Decision Intelligence

Marketing Intelligence