Marketing Intelligence
Social Media KPI · June 25, 2026 · 11 min read
Follower growth is often dismissed as a shallow metric, a vanity number to be tracked but not taken seriously. That dismissal misses what the metric actually tells you when it is read the right way. Follower growth, tracked continuously and interpreted correctly, is one of the strongest leading indicators of brand momentum available to a marketing team — often visible before campaign metrics move, before search trends shift, and before the brand health survey catches up. Here is how to read it as the leading indicator it is.
Follower growth is often dismissed as a shallow metric. Marketing textbooks warn against optimizing for it. Executives are trained to look past it toward more sophisticated indicators. Social teams themselves often relegate it to a secondary row in the monthly report. The dismissal has some justification — follower count can be misleading when read in isolation, and chasing follower growth without regard to engagement produces the worst kind of vanity-metric optimization.
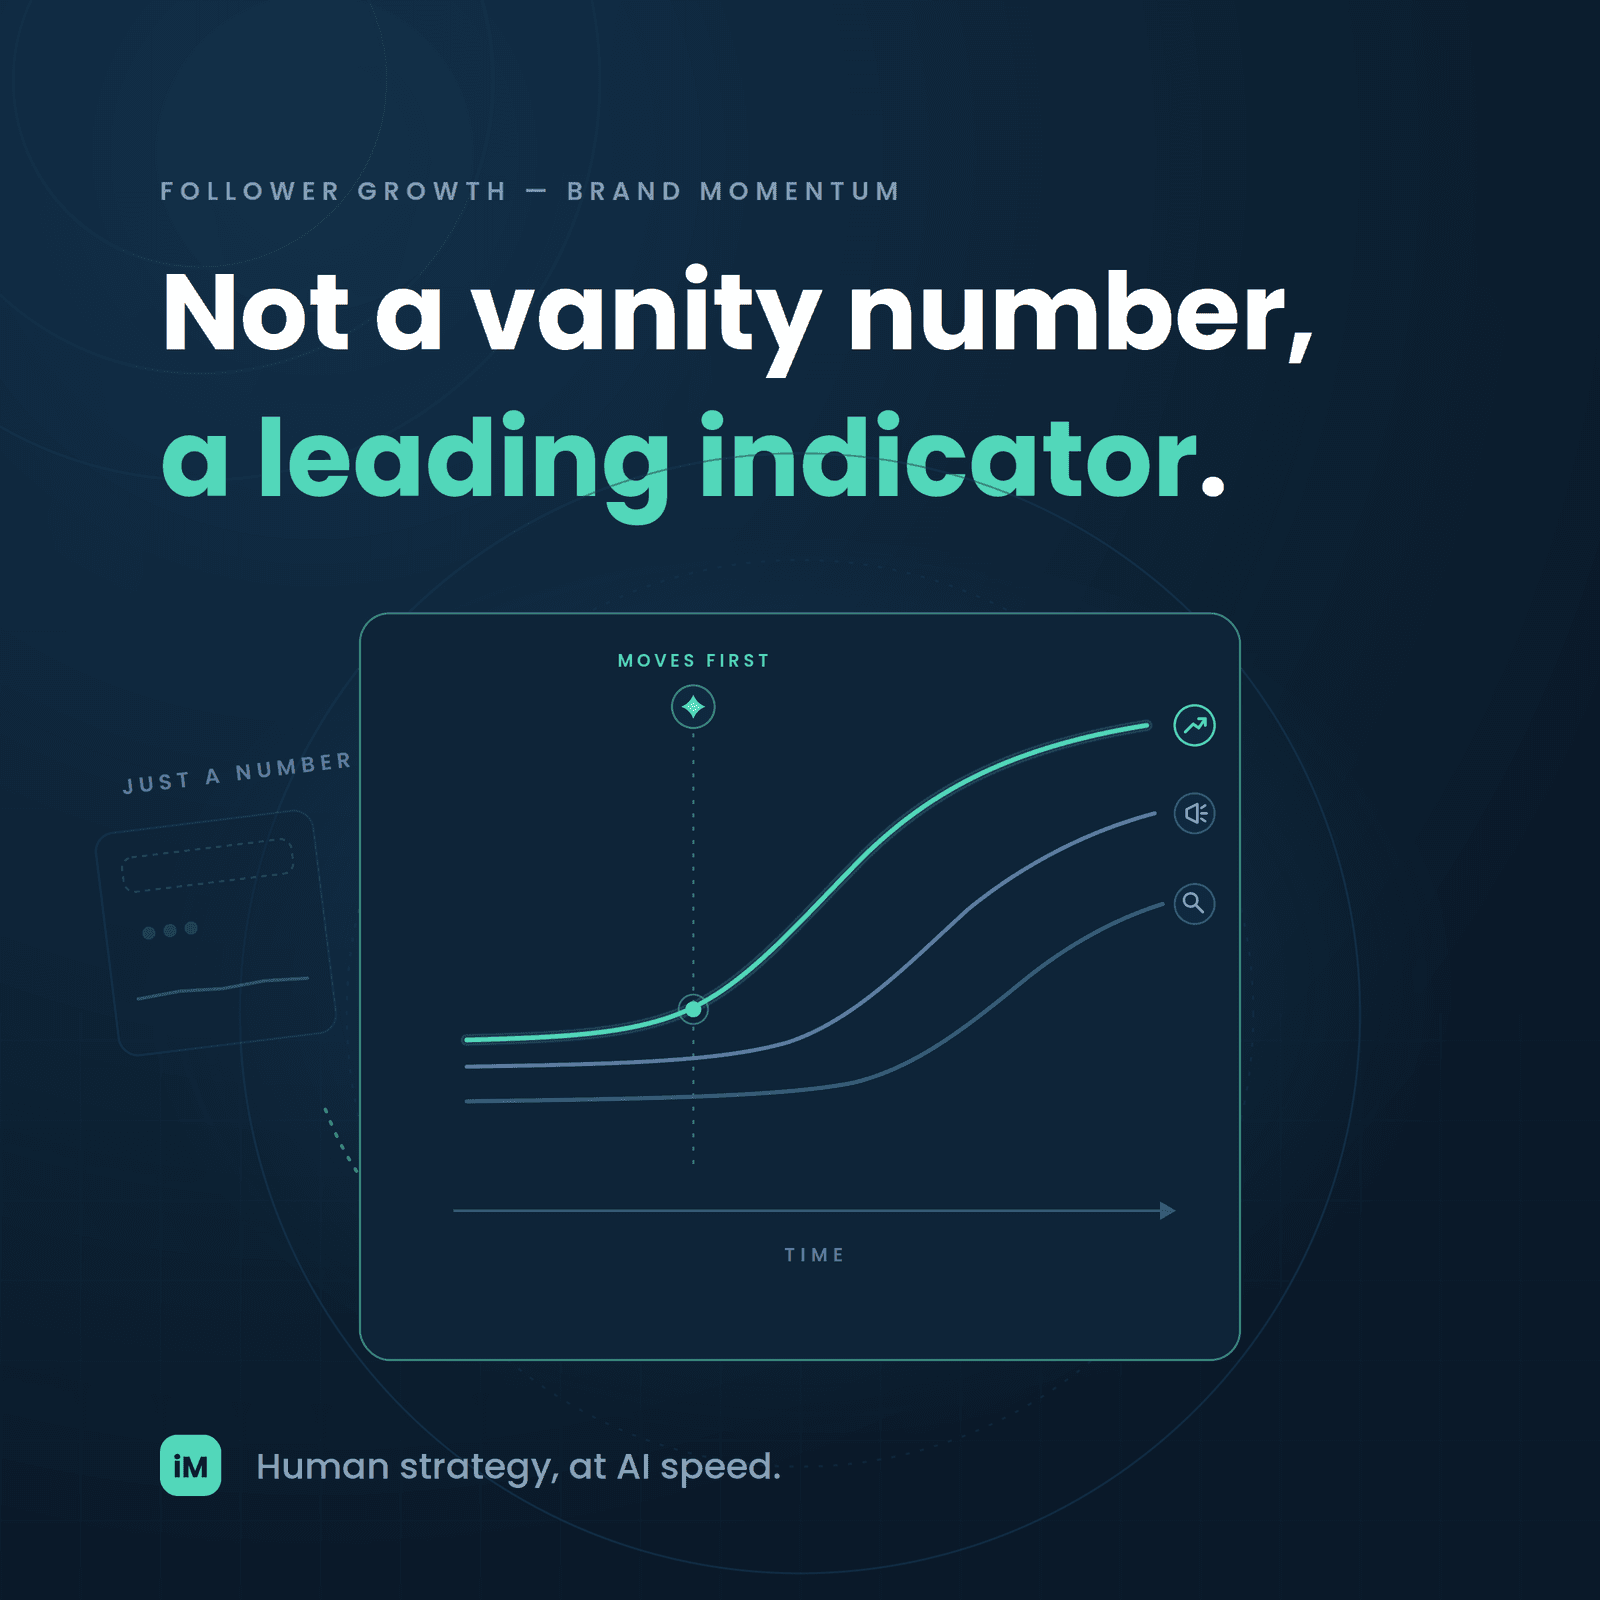
But the dismissal, when it becomes reflexive, misses what the metric actually tells you when it is read the right way. Follower growth, tracked continuously and interpreted correctly, is one of the strongest leading indicators of brand momentum available to a marketing team. It moves before campaign metrics move. It shifts before search trends catch up. It signals changes in brand health that survey-based measurement will only detect two or three quarters later. The teams that read it correctly have a real information advantage against the teams that dismiss it.
This piece walks through why follower growth is a leading indicator when read correctly, what "read correctly" actually means in operating terms, and how enterprises are treating follower growth momentum as an early-warning signal rather than as an afterthought in the monthly report.
Follower growth is a leading indicator because it sits close to the moment of decision the audience is making. When a person follows a brand's account, they are making a small but real commitment. They are saying that they want to see more from the brand. They are opting into ongoing exposure. That decision is not free — it costs the person a small amount of feed real estate, and it exposes them to future content whether or not that content is welcome.
The decision to follow is therefore an early signal of the person's relationship with the brand. It happens before they buy, before they consider the brand for a purchase, before they research the category, before they show up in the traditional funnel measurement. When the number of people making that decision changes materially — either up or down — the shift is a leading signal of a broader shift in how the audience is engaging with the brand.
The three moments where this is most visible make the leading-indicator character clear.
A campaign, a product launch, or an unexpected piece of content that resonates broadly typically shows up first in follower growth. The audience discovering the brand for the first time follows the account before they consider a purchase. Follower growth accelerates ahead of the campaign metrics, ahead of the sales pipeline effect, sometimes ahead of the search trend signal. A team watching follower growth momentum sees the resonance moment early. A team ignoring it learns about it from downstream metrics that will show up weeks or months later.
The reverse case is equally instructive. A brand that is quietly losing relevance in its category typically shows the erosion first in follower growth — new followers slow down, unfollows tick up, net growth decelerates. This shift often precedes the brand health survey signal by two or three quarters, and precedes the sales impact by longer than that. A team watching follower growth momentum sees the erosion early enough to respond. A team dismissing follower growth learns about it from a sales report that arrives too late to be a leading indicator of anything.
When a competitor launches a well-received campaign or a strong product, the effect on the brand's own follower growth is often measurable within days. Audience attention that was previously distributed across the category shifts toward the competitor, and the brand's follower growth slows even though nothing about the brand itself has changed. A team watching follower growth momentum picks up the competitive move quickly. A team that is only watching its own campaign metrics may not connect the slowdown to the competitor's move at all.
The leading-indicator value of follower growth only materializes when the metric is read in a specific way. Reading it incorrectly — as an absolute number to be maximized, or as a monthly total to be trended — misses most of what makes it useful.
The total follower count is a lagging measure of past decisions. The growth rate — new followers minus unfollows, expressed as a percentage of the base — is a measure of what is happening now. A brand with a large follower total but a stagnant growth rate is coasting on past momentum. A brand with a smaller total but a strong growth rate is currently earning attention. The leading-indicator signal is in the rate, not in the total.
Follower growth momentum shifts on daily timescales. A campaign lands, and growth accelerates within days. A competitor moves, and growth decelerates within days. A monthly report that shows the aggregated growth for the period misses the intra-month pattern. Continuous tracking — with rolling seven-day and thirty-day growth rates — surfaces the shifts as they happen and lets the team investigate causes while the signal is fresh.
Follower growth on different platforms reflects different signals. Growth on a professional network platform may signal recognition among a specific professional audience. Growth on an entertainment-first platform may signal broader cultural resonance. Growth on a video-first platform may signal that specific content is breaking out. Reading follower growth in aggregate misses these platform-specific signals. Reading it per platform preserves them.
A 5% quarterly growth rate is strong in some categories and weak in others. A brand growing followers 5% in a category where the average is 2% is meaningfully outperforming. A brand growing 5% in a category where the average is 10% is losing ground even though the number looks positive. The leading-indicator reading requires the category baseline for calibration.
When follower growth is being tracked correctly — as a rate, continuously, per platform, against category baselines — the metric becomes an input to several decisions the team is already making.
The leading-indicator framing is powerful, but it is not universal. There are several things follower growth is not, and being clear about them keeps the framing honest.
Follower growth is not a substitute for engagement measurement. A brand that grows followers without earning engagement from those followers is accumulating a passive audience that will not drive downstream outcomes. Follower growth momentum is a leading signal, but the engagement rate is what tells the team whether the growth is producing a real audience or a superficial one. The two metrics belong together, not as substitutes for each other.
Follower growth is not a substitute for downstream conversion measurement. A brand cannot conclude from follower growth alone that revenue will follow. The connection between the two is real but not deterministic — it depends on the brand's ability to convert the audience into buyers, which is a separate discipline. Follower growth being strong is a positive signal. It is not a guarantee.
Follower growth is not immune to manipulation. Buying followers, running artificial engagement campaigns, or exploiting platform loopholes can produce follower growth numbers that do not reflect genuine audience relationship. The leading-indicator framing depends on the growth being organic. A team that reads follower growth correctly is also looking at the composition of the growth — is it plausible, is it in the right audience, does it match the platform's normal patterns — not just the headline number.
The dismissal of follower growth as a vanity metric is often reinforced by how it is presented to executives. When the metric appears as a single number on a slide — "we grew followers 12% this quarter" — it invites the vanity-metric response. When it is presented as a leading indicator with the analytical context, it earns a different reception.
The executive presentation of follower growth as a leading indicator has a specific shape. The growth rate is presented as a rolling continuous measure rather than as a period total. The rate is compared against category baselines so the number is contextualized. Correlations with campaign timing, competitive moves, and brand health signals are made explicit — this quarter's follower growth accelerated during the campaign period, this platform's growth decelerated during the competitor's launch. The metric is not being presented as a bragging point. It is being presented as evidence of specific market dynamics the executives should know about.
This presentation earns executive attention because it is not asking the executive to accept a vanity metric on faith. It is presenting the metric as intelligence about the market, with the analytical context that makes it actionable. Executives who have dismissed follower growth in aggregate often engage with it seriously when it is framed this way, because the framing matches the leading-indicator character the metric actually has.
Follower growth is dismissed most often by teams who read it as a total to be maximized. The teams that read it as a rate, continuously, per platform, against category baselines, discover a leading indicator of brand momentum that beats every other available signal to the moment of shift. The dismissal is a habit, not a conclusion.
inMOLA's Social Media KPI module tracks follower growth as a rate rather than as a total, continuously across the six major platforms, with the daily snapshots that make the leading-indicator character visible. The growth rate view lets the team see the acceleration and deceleration patterns that a monthly aggregate would smooth away, and the per-platform breakdown preserves the platform-specific signals that a cross-platform aggregate would blur.
The trend graph shows growth rate over time rather than only the current level, so the leading-indicator moments — the acceleration during a campaign, the deceleration during a competitor move — are visible in the graph itself. The team can spot the pattern in the trend, investigate the cause, and act on the signal while it is still fresh. The rolling comparison against the prior period lets the team see whether momentum is building or fading, without needing to construct the analysis separately from the raw data.
The strategic value of treating follower growth as a leading indicator rather than as a vanity metric is that the team gets an early-warning signal on multiple market dynamics — campaign resonance, competitive threats, brand health erosion — with a lead time no other social metric provides. In 2026 the social teams that use this early-warning signal effectively are the ones whose responses to market shifts are proactive rather than reactive. The teams that continue to dismiss follower growth as a vanity metric will continue to find out about the same shifts through downstream signals, months later.
Marketing Intelligence
Decision Intelligence

Marketing Intelligence